AI-Powered Agriculture
Predict Yields.
Predict Yields.
Detect Stress.
Optimize Every Acre.
Agrocept combines satellite intelligence, machine learning, and agronomic science to help farmers maximize yields, reduce input costs, and grow sustainably.
94%
Yield Prediction Accuracy
30%
Avg. Fertilizer Savings
15+
Satellite Data Sources

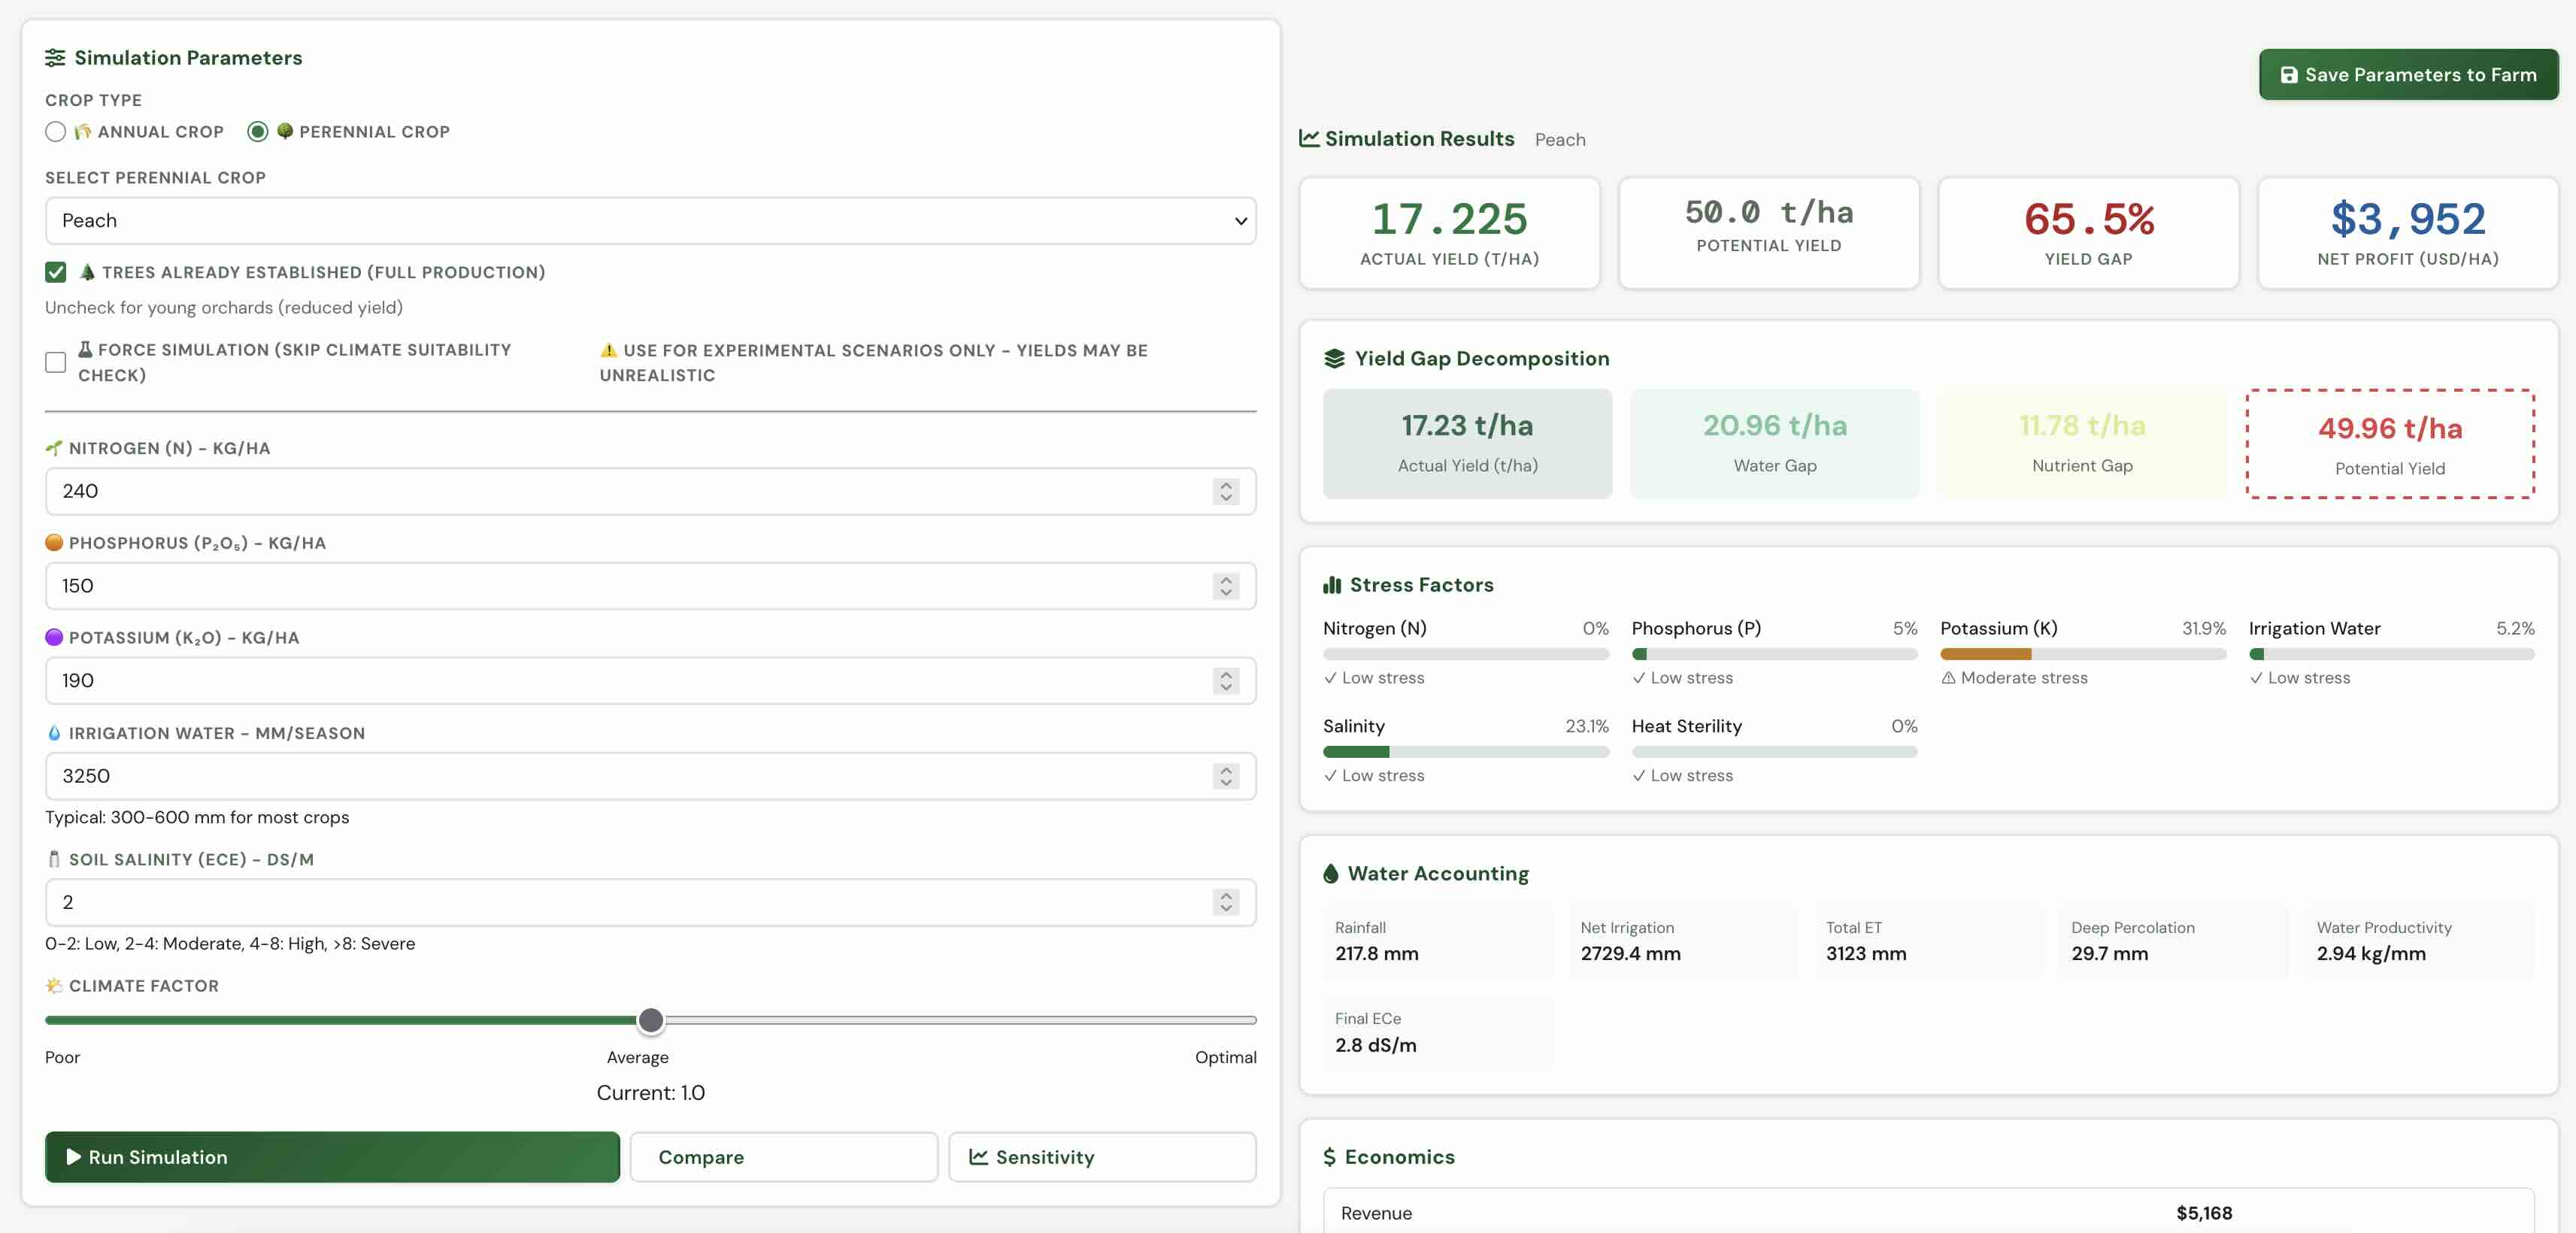
Pred. Yield
7.2 t/ha
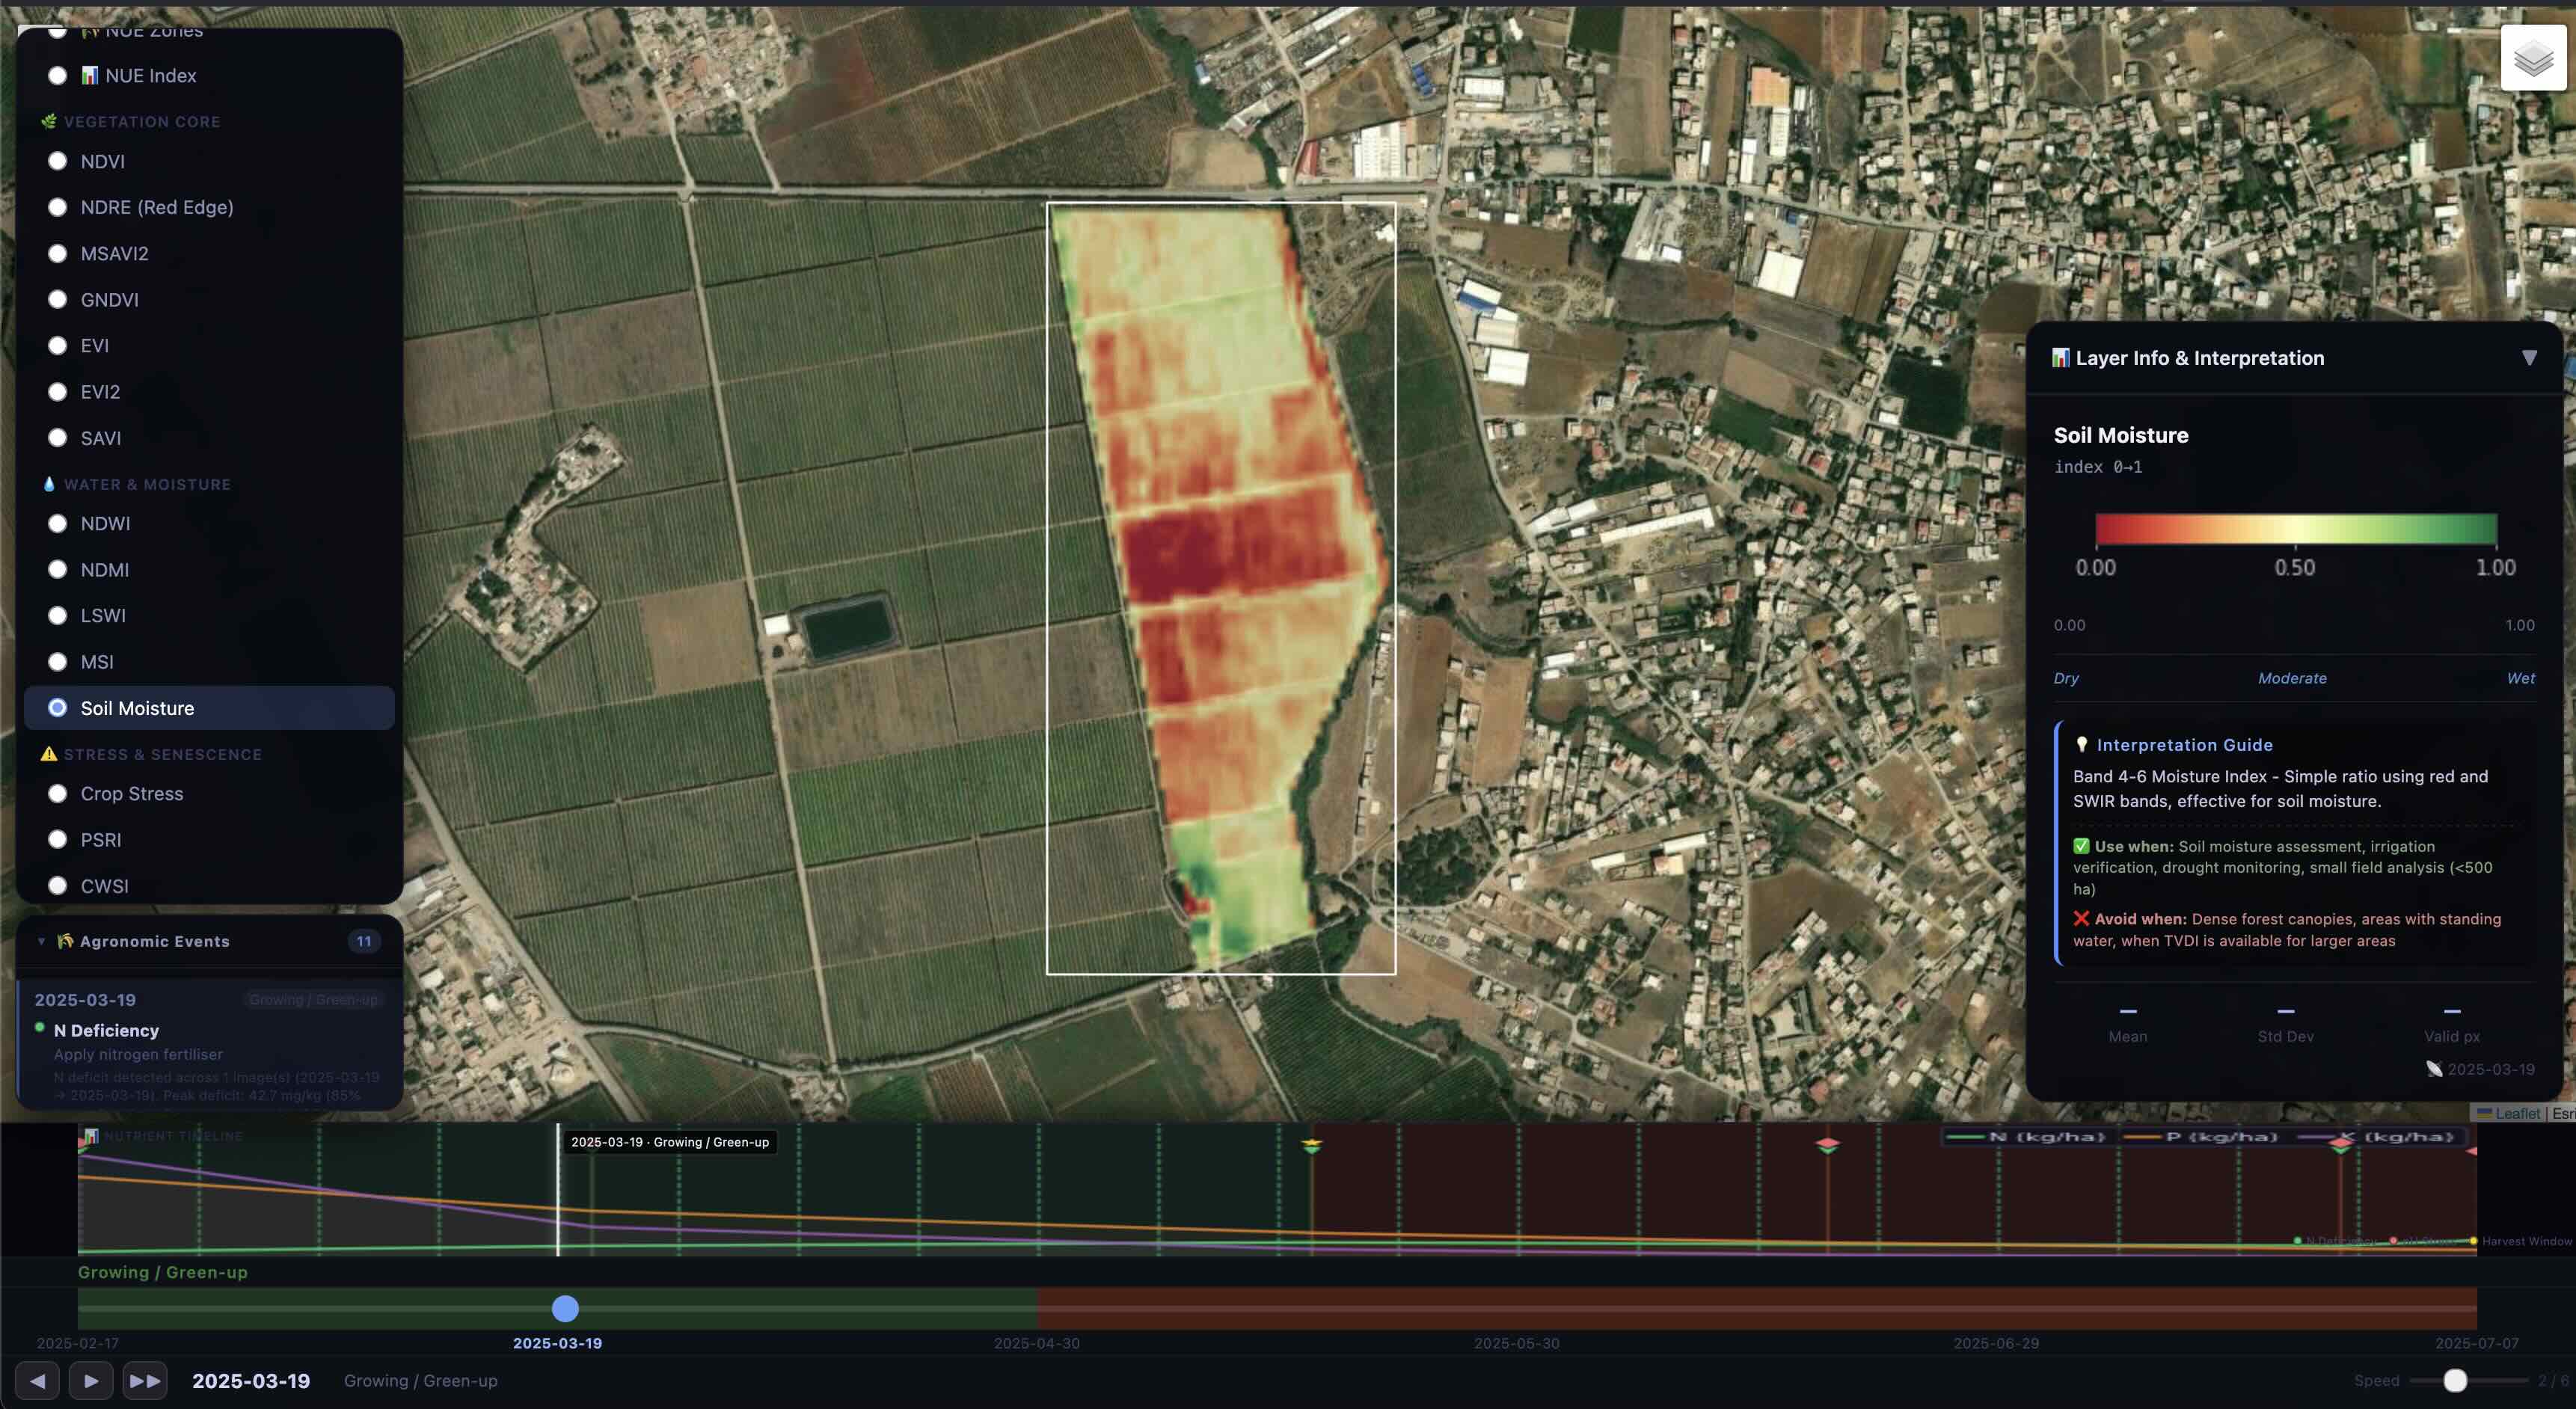
Soil Moisture
68%
NDVI
0.78
Stress Index
32%